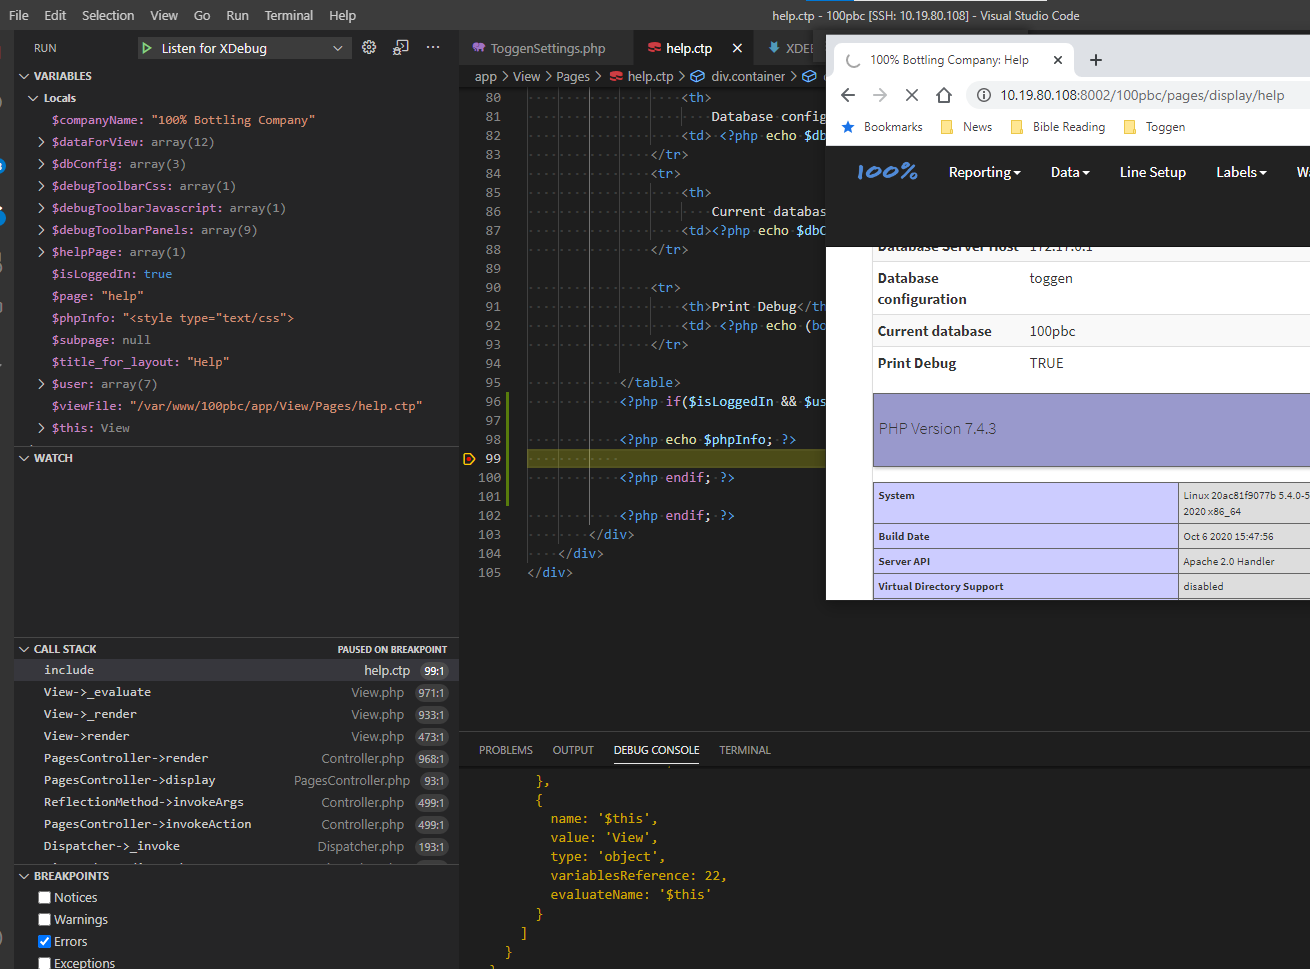
My Layout
I'm connecting from VSCode running on Windows 10 Pro to the Linux host via SSH. The Linux Host has the project files and there is a docker container running on the Linux Host which provides the LAMP stack development environment.
This is how I got XDebug working

+---------------------------------------+
|  Windows 10 Pro with VSCode Installed |
+-------------10.19.80.115--------------+
                    |
                   SSH
                connection
                    |
   +----------10.97.30.108------------+
   |   Linux Host with project files  |
   |  /home/jm/onedrive/sites/100pbc  |
   |                |                 |
   |    +---------Docker---------+    |
   |    |       172.17.0.1       |    |
   |    |           |            |    |
   |    |     docker network     |    |
   |    |           |            |    |
   |    |       172.17.0.2       |    |
   |    |  [ Docker container ]  |    |
   |    |                        |    |
   |    +------------------------+    |
   +----------------------------------+
Project files on Linux host: /home/jm/onedrive/sites/100pbc
Path to project files in docker container: /var/www/100pbc
VSCode Extensions
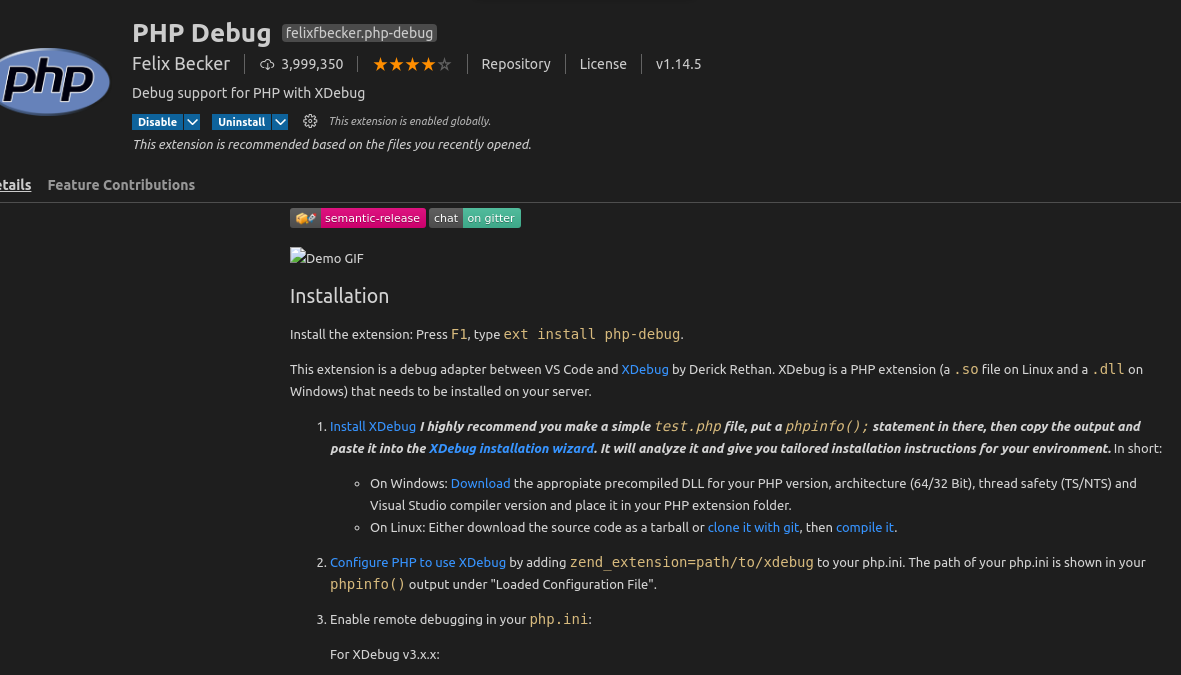
- VScode instance running on Windows 10 Pro install the PHP Debug extension by Felix Becker
ext install php-debug - You also need "Visual Studio Code Remote Development Extension Pack" to allow for SSH to remote host
XDebug
In the docker container compile and install Xdebug 3
Use the install instructions that come in the php-debug extension in VSCode

Add the following to /etc/php/7.4/apache/php.ini and /etc/php/7.4/cli/php.ini in the Docker container. Adding the configuration to both the apache and cli areas allows you to debug your tests from the command line as well as get debbugging information when navigating your site via a browser.
Note: Make sure you restart the container when you make changes.
Set xdebug.client_host to the docker IP address of the Linux host
**Note: ** xdebug.remote_host didn't seem to work perhaps it is an old version 2 setting. But xdebug.client_host did.
[xdebug]
xdebug.mode = debug
xdebug.remote_enable = 1
; xdebug.remote_connect_back = 1
; xdebug.remote_host = 172.17.0.1
; this
xdebug.client_host=172.17.0.1
xdebug.idekey = "VSCODE"
xdebug.client_port = 9000
xdebug.remote_autostart = 1
xdebug.start_with_request = yes
xdebug.log=/tmp/xdebug-local.log
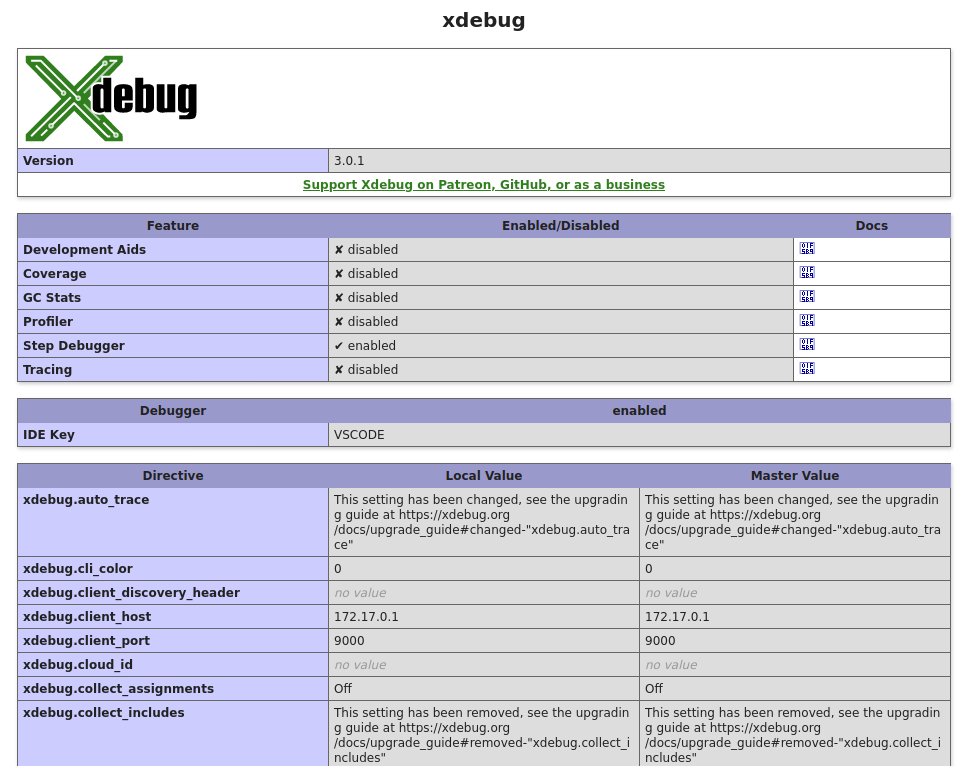
Check your setup by adding a file with phpinfo(); into somewhere accessible to your containers Webserver. You should see XDebug listed

Configure launch.json
/home/jm/onedrive/sites/100pbc/.vscode/launch.json on the remote linux host
hostname: is set so the XDebug client in VSCode will listen to the docker IPv4 Address of the Linux host
{
    // Use IntelliSense to learn about possible attributes.
    // Hover to view descriptions of existing attributes.
    // For more information, visit: https://go.microsoft.com/fwlink/?linkid=830387
    "version": "0.2.0",
    "configurations": [
        {
            "name": "Listen for XDebug",
            "type": "php",
            "request": "launch",
            "port": 9000,
            "hostname": "172.17.0.1",
            "pathMappings": {
                "/var/www/100pbc/": "${workspaceRoot}/"
            },
           "log": true
        },
        {
            "name": "Launch currently open script",
            "type": "php",
            "request": "launch",
            "program": "${file}",
            "cwd": "${fileDirname}",
            "port": 9000
        }
    ]
}
Troubleshooting
If you have done the above and your break-points are not being hit
Check that the pathMappings settings map to real files in both the container and on the SSH'd host
Container Path
/var/www/100pbc/src/Controller/PagesController.php <= this needs to exist
SSH Host Path
The workspaceRoot is the folder you have open in VSCode
${workspaceRoot}/src/Controller/PagesController.php
/home/jmcd/dev/project1/src/Controller/PagesController.php <= this needs to exist
{
   "configurations": [
        {
            // ... other settings
            "pathMappings": {
                "/var/www/100pbc/": "${workspaceRoot}/"
            },
        },
}

Your article should have more comments! I couldn't find anywhere a way to make it work this layout!
Glad it helped!
Glad I could help 🙂
James
My VSCode listen to xdebug already but still cannot capture the breakpoint.
In xdebug-local.log return this message:
[Step Debug] ->
[30] [Step Debug] ->
Sorry about my English
This could be docker network settings.
The
xdebug.client_host=172.17.0.1might be incorrectly point at the wrong IP for your docker networkRun the following on the computer with the container
docker inspect --format='{{json .NetworkSettings.Networks}}' name| jqReplace "name" with your container name or id
{

  "bridge": {

    "IPAMConfig": null,

    "Links": null,

    "Aliases": null,

    "NetworkID": "41013fa7e9e68cfa428d79a4475b09d41fd93b108d8910c98bfbd3000c30f8bf",

    "EndpointID": "240e27e84e46d5f56ae773afd58d9b835c4e5064c01cc2d434c5fd8b9a8d855a",

    "Gateway": "172.17.0.1",

    "IPAddress": "172.17.0.17",

    "IPPrefixLen": 16,

    "IPv6Gateway": "",

    "GlobalIPv6Address": "",

    "GlobalIPv6PrefixLen": 0,

    "MacAddress": "02:42:ac:11:00:07",

    "DriverOpts": null

  }

}
It should output which network your container is on and the container IP and Gateway IP Addresses then change your
xdebug.client_host=value to have the Gateway IP.The command return this
{
...,
"Gateway":"172.23.0.1",
"IPAddress":"172.23.0.6",
...,
}
So I fix php.ini:
xdebug.client_host=172.23.0.1
and launch.json
"hostname": "172.23.0.1",
I restart my service php-apache in container but still have the same error
I add more breakpoint in VSCode then more logs appear in xdebug-logs inside container. So I think IP is OK, but breakpoint is not. I cannot be captured and become unverified break-point.
I release in launch.json I have error when mapping container folder and remote folder. My debug work well now. Thanks for many help. This topic is very useful
Glad you fixed it Thang. I have done that myself. Thanks for posting your answer
Will update my post to include that gotcha